Forming Limit Curves made easy
FLCs (Forming Limit Curves) are essential tools for evaluating the formability of parts, showing the maximum level of strain a material can take before splitting. The challenge is in making them. The traditional approach (Nakazima or Marciniak) has three main issues:
1) It requires a lot of material, time and testing to generate them
2) You measure one sample of material, so have to make a guess to accommodate material property variation
3) You gain unwanted test artifacts that affect the accuracy of the results
As a consequence, the use of the experimental FLC in simulation software and part safety evaluation in the press shop is not the best option. The alternative is to use a calculated FLC. These can be generated from mechanical properties determined from a tensile test by means of e.g. regression analysis.
In this blog I want to explain the benefits of the Abspoel Scholting FLC, how it compares to other calculated FLCs and how it tackles the 3 issues mentioned above.
Comparison to the Keeler FLC
Of the calculated FLCs the Keeler FLC is the most widespread model that has been around for an exceptionally long . However, the Keeler FLC was developed in 1970s, a time when only mild steels were available and indeed, for these steels, the Keeler FLC works fine. For today’s steel grades (especially AHSS), the correlation increasingly weakens and the FLCs cannot be determined with the Keeler FLC because the chance of significant errors is simply too large.
In the picture below an example is shown for a dual phase steel grade. Two points are clear here. The Keeler method gives an FLC that is too high and the slope of the left-hand side of the FLC is not 45°. Both these factors can result in parts being considered feasible, which are not, leading to extensive repair work in the press shop and expensive die modifications.
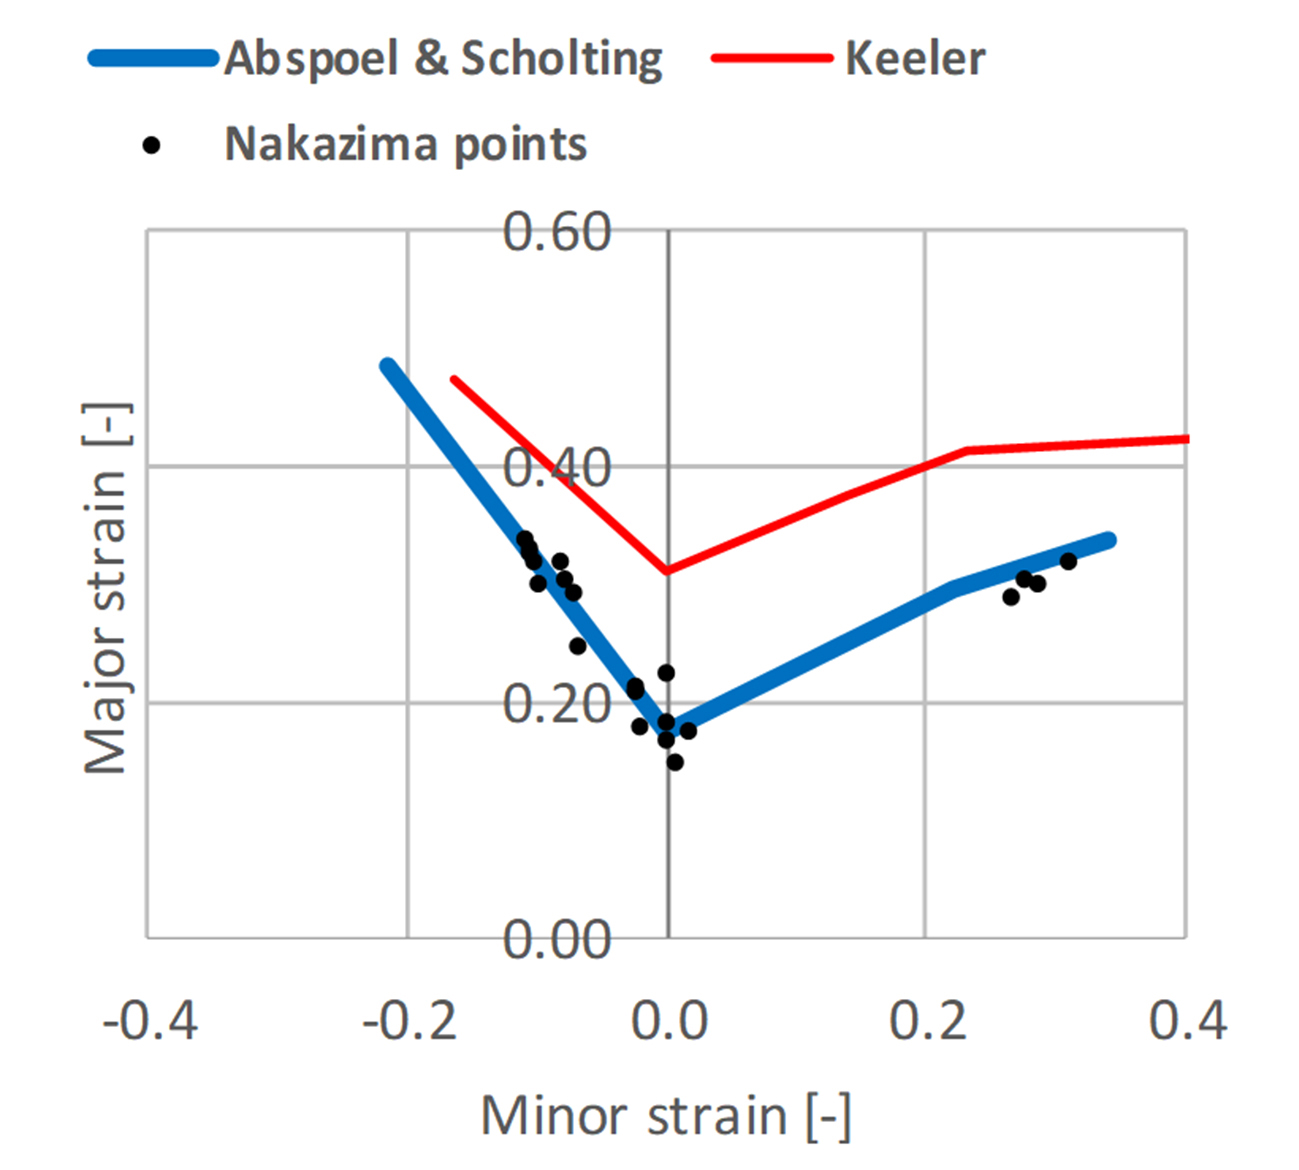
Figure 1: Comparison of a dual phase steel – strains of measured Nakazima samples versus Abspoel & Scholting FLC and Keeler FLC
The test artifact issue thickness
The Abspoel & Scholting FLC is an empirical model, where multiple specific points of measured FLCs are correlated with tensile test data for today’s wide range of low carbon steels, high-strength and advanced high-strength steels. The tensile data used is total elongation A80, strain ratio (i.e. r-value) and the thickness.
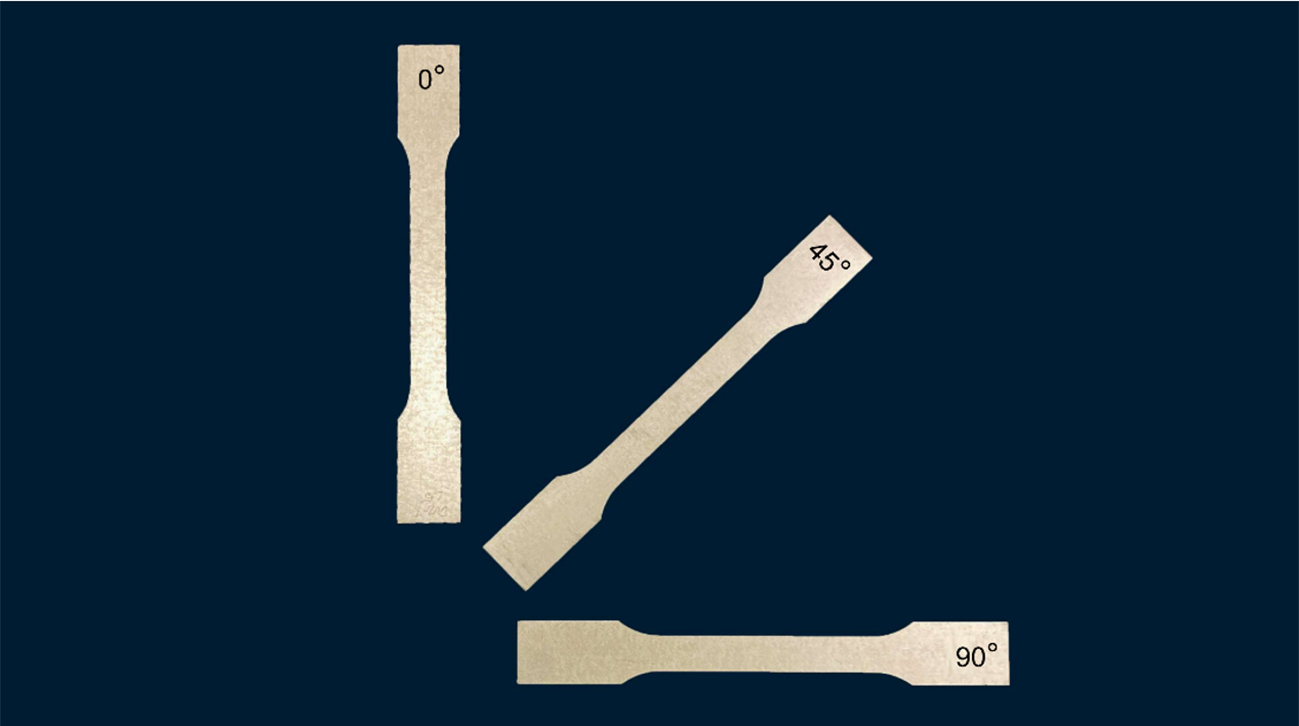
Figure 2: three directional tensile test samples
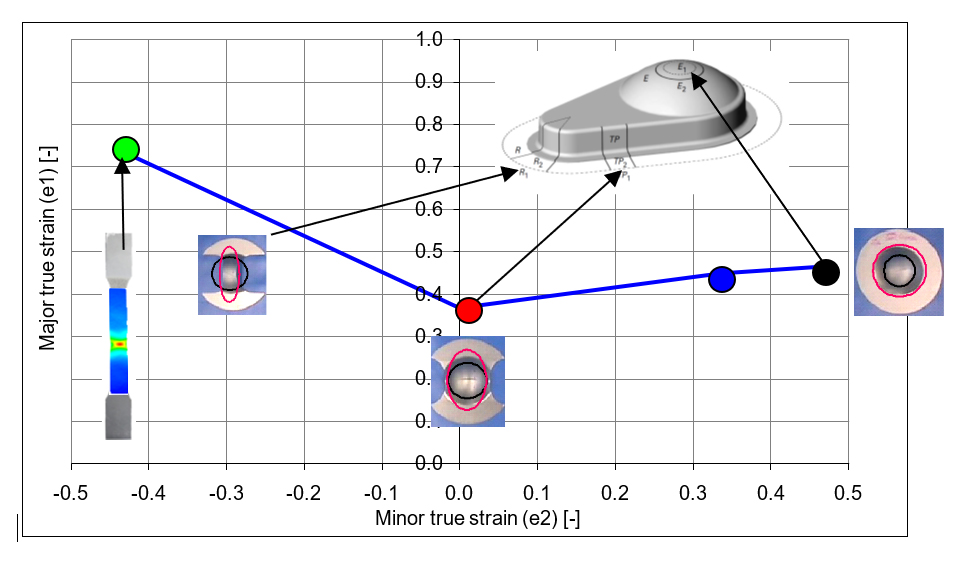
Figure 3: The four points of the Abspoel & Scholting FLC predicted from three directional tensile tests
Compared to the measured FLC, the Abspoel & Scholting FLC determines the curve for the midplane strain, and not the outer surface. The curved surface in the Nakazima test gives a higher outer surface strain than the neutral line in the material itself. The thicker the material and the smaller the radius the larger the difference between neutral line and outer surface strain.
In the Nakazima test the curved surface of the hemispherical punch has another effect: it causes a biaxial pre-strain in the test specimen. Before deforming the material on the desired strain path, the spherical shape is pushed into the material and causes a biaxial strain. For a plane strain sample, which is meant to have no strain in the minor direction and all the strain in the major direction, the specimen will have a positive minor and major strain first, and once settled, will continue the strain path straight up as a plane strain sample should do. The result however is that the lowest point in the FLC is shifted to the right and downwards. This biaxial pre-strain artefact of the Nakazima test has the effect of lowering the measured FLC significantly and limits the potential of the material where it matters most: near the plane strain (where minor strain is zero).
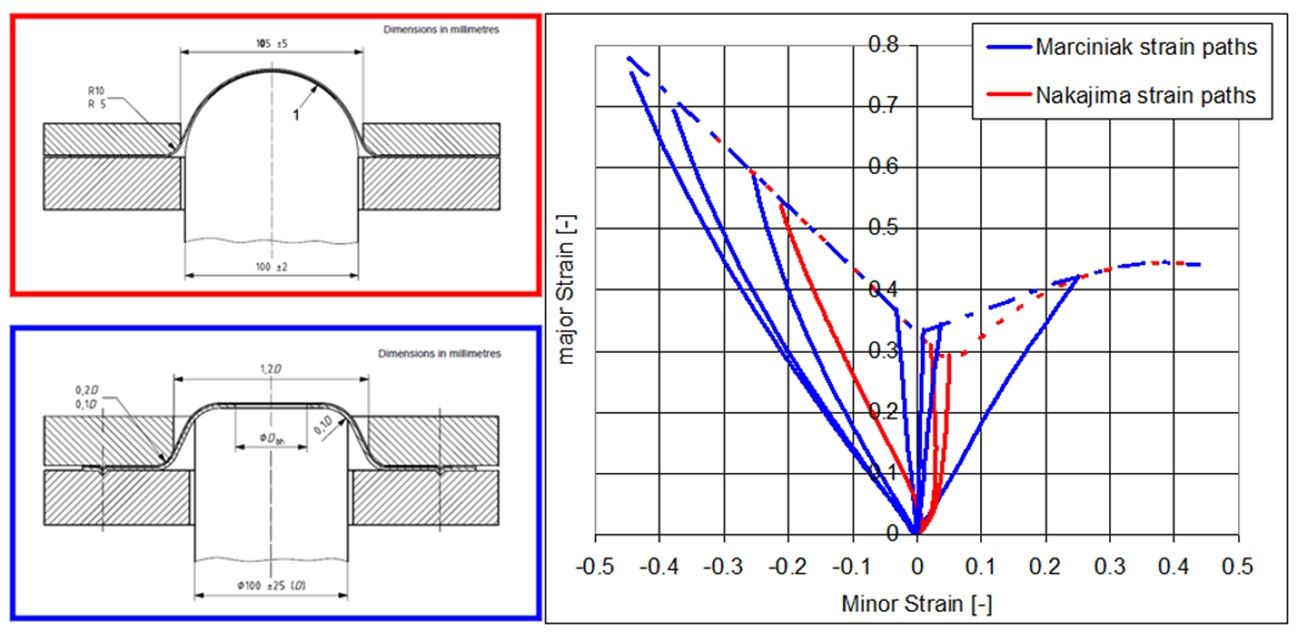
Figure 4: Biaxial pre strain in Nakazima test
For materials where the FLC is low and the r-value is low the Nakazima test has yet another disadvantage: there are not enough data points on the left side of the FLC spectrum to fit a decent curve. It is often seen that fitted curves or estimates of the left side of the FLC are very inaccurate, which can result in not detecting necking in a simulation. This again leads to those potential failures in the press shop or in the other direction, an underestimation of the materials potential, resulting in unnecessary design changes, tooling work or even a compromise on the material choice.
Traditionally this problem was not recognised as the slope on the left was always assumed to be 45° and then only one good (starting) point is needed. However, investigations of the necking behaviour on the left side with tensile and Marciniak specimens showed that the left side of the FLC is dependent on the r-value. The traditional 45 degree curve was proven incorrect and in the calculated FLC the correct slope on the left side is now allowing the designer to use the material’s full potential or detect the necking failure correctly in the simulation.
Time and material needed for testing
The Abspoel Scholting FLC is calculated from a tensile test: which means less test material is needed to make a curve and you do not have to estimate material variability.
The issue of the time taken to make an FLC is solved for the Abspoel Scholting FLC because, as already mentioned, it is calculated from a regular tensile test thus requiring significantly less time, material, and equipment. Another advantage of the calculated FLC is that it is easy to determine the FLC for multiple directions instead of only transverse as is done experimentally. The direction dependent FLC can be used, for example to evaluate if a change of rolling direction improves part safety. In addition, by combining the FLCs generated in multiple directions and from multiple coils of the same grade, you can get a feel for the actual range of FLCs per grade. This allows, if so desired, the selection of the worst case FLC, so that in principle, an estimated safety limit from the FLC perspective is not necessary anymore.
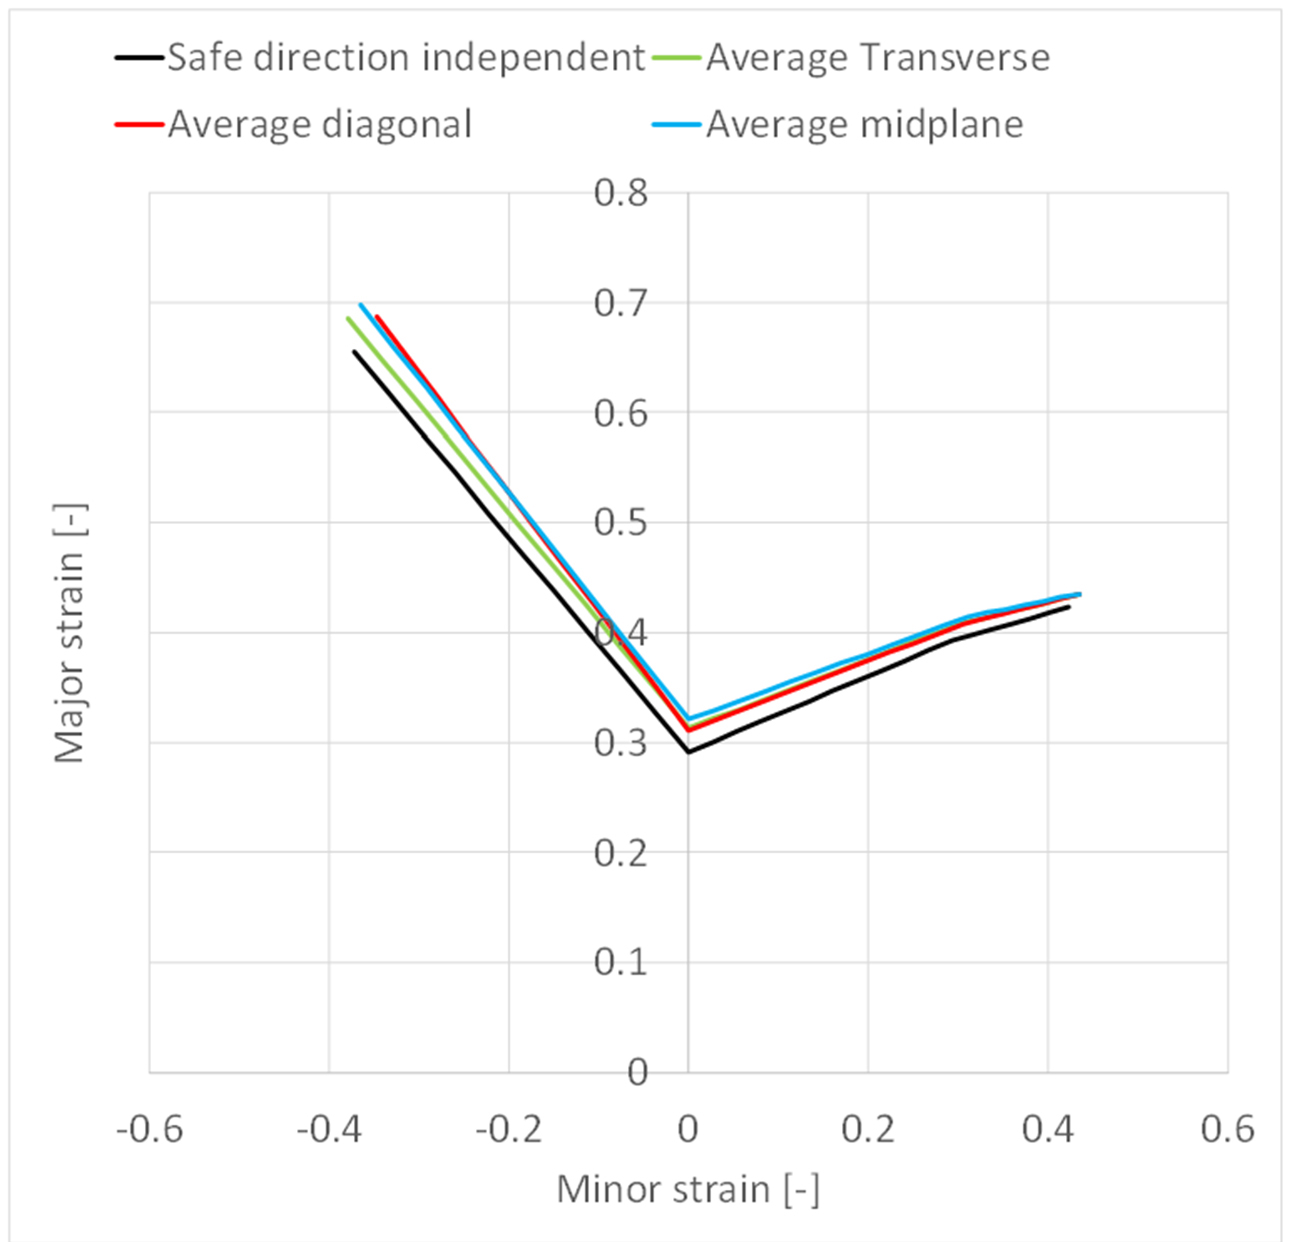
Figure 5: Direction dependent average FLCs and direction independent safe FLC
In simulations, there is an additional benefit in relation to the thickness dependency as this can be automatically included. For simulation software in which the model has been implemented this means that the FLC is automatically calculated for the thickness of that part. If there is a change in material thickness the FLC will automatically adjust.
Aurora® Online Material Database
These benefits mean that Tata Steel, can give an accurate FLC for every material card provided, regardless of the thickness. Tata Steel’s material database Aurora Online provides the data and material cards for most of its materials in several thickness-classes. Our customers (i.e. automotive OEMs and tiers) can download these files and directly plug them into their simulation software. The material cards for software which have the Abspoel & Scholting FLC model implemented will have the full benefit of the thickness dependence. The material cards for the software packages where the model is not (yet) implemented are supplied with the calculated FLC in tabulated form.
Aurora® Online offers Tata Steel’s customers on demand access to representative material data and advanced material models . Find out more about Aurora Online.
